Monthly Archives: March 2018
802.11 – WIFI IFs
Posted by on March 30, 2018
Inter frame spacing is some of the magic in WiFI. Its also one of the more confusing aspects of studying and understanding how WMM, and processes like Point coordination function work. Inter frame spacing is used to help avoid collisions on the wireless spectrum.
When a station wants to send a frame there are two methods that have to be OK before it can do this. 1 – Physical Carrier sense. Physical Carrier Sense is the process of checking to see if the wireless medium is busy. It does this my checking the wireless medium for RF energy, if it is above a certain threshold then it will wait to send.
The second check is Virtual Carrier sense. This method looks at passing wireless frames and sets a local MAC layer timer called the Network allocation vector or NAV to the amount of time found in the passing frame’s Duration field. When this reaches 0 it attempt a Physical Carrier sense. If the NAV is 0 and Physical Carrier sense shows RF energy below its threshold – the station will then wait the length of a Interframe space, then wait through the random backoff algorithm time (decided by the contention window), run through the carrier sense process again – then will actually send the frame.
The importance of the IFS is that the station has to wait that given amount of time. In the section below all the different IFS are listed with the its length of time. When studying for the CWAP exam I had a hard time remembering them, so hence the blog entry.
Once the station has the okay to send (Carrier sense is good) then it will wait the given IFS length. This is a big deal because not only does the STA wait the length of time before attempting to send the frame, but it can be used to give priority to certain frames over others. We do this by having that station wait less time then others based on the type of frame they are sending. By Priority I mean it asks the client to wait a smaller amount of time before sending the packet with a higher priority – This is called Probabilistic priority.
The following is a quick list of interframe spacing methods and are ordered by the duration time – shortest to longest time.
RIFS – Reduced IFS – Shorter than SIFS. Came out in 802.11n , to help minimize overhead. RIFS are used when one transmitter is sending packets when no SIFS reponses are expected. This IFS is not used in 802.11ac.
SIFS – Short Interframe Spacing – Shortest of all IFs . Used for ACKs, CTS in response to RTS, and the first data frame following the CTS.
PIFS – Point Coordination interframe space. – Used by the Point Coordination function to gain access to the medium. Used when switching from Distributed Coordination to Point Coordination
DIFS – DCF (Distribution coordination function) Interframe spacing– used with normal data frames. After the completion of sending a data frame the duration of a DIFS must be waited before attempting to send another.
AIFS – Arbitration IFS – Used in a kind of QoS manner. When a QoS station send data frames it waits an AIFS. Also used on a few control frames such as PS-Poll, CTS when not responding to a RTS (Thats a SIFS), BlockACKs, and RTS frames. A neat thing abou the AIFS is that the time is configurable on the AP, and then transmitted to clients by the Beacon frame.
EIFS – Extended IFS – Extended for a reason – When a frame is received with errors or corrupted the receiver will respond with EIFS which tells the sender to wait for a longer period so it can see if the packet was delivered correctly. Once this happens, it will start go back to using a normal DIFS or AIFS .
Inter frame spacing gives us another mechanism to help avoid collisions in 802.11. It does this by having the Station wait a given amount of time (IFS) according to the type frame being sent. We do this by utilizing Carrier sense, random back off timer, IFS and contention windows.
802.11 Spectrum Analysis – useful graphs
Posted by on March 23, 2018
Spectrum analysis in 802.11 design is extremely important. Detecting which channels are in use in 2.4 and 5 gig spectrum’s as well as the channel density is a great help when channel planning or troubleshooting wifi issues. There are lots of graphs within any spectrum analyzing software. Below are a few that I feel really help narrow down issues within spectrum.
FFT Graphs
FFT stands for Fast Fourier Transform – Which is an algorithm that samples signals over a period of time. One of the most usable graphs when looking at the spectrum is the FFT density graph and the real time FFT graph. I am currently using Fluke’s or now NetScouts SpectrumXT.
The below images shows the FFT of our office. As you can easily see just from the FFT graphs that channel 124 and 128 is heavily in use. This is because of a few reason – 1 we are using 40 MHZ channels so channel 124 and 128 are combined. 2 – the AP using these channels are the closest to me, the other APs are pretty far away.
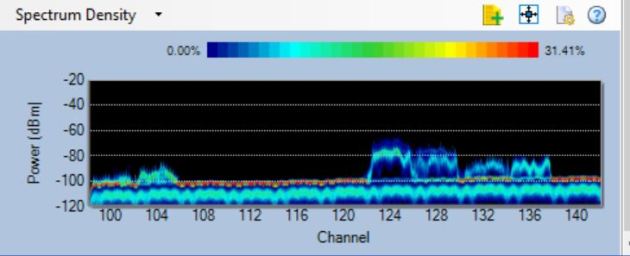
So why is this important during a survey or just checking to see whats going on – its important because it shows the amount of energy used on those channels. An abundance of energy will cause slowness and clients to defer sending as well as packet loss. Understanding and viewing spectrum is also extremely important in channel selection and design.
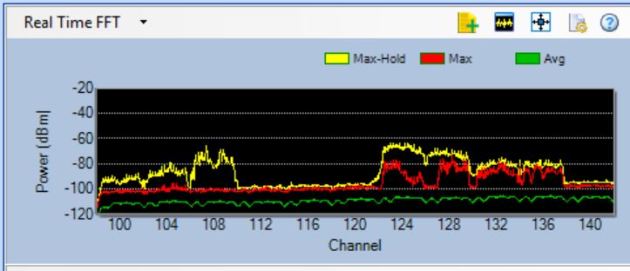
So lets compare the above with the Real time FFT – the Real time graph changes as the name states very often. But the Density and Real Time should be pretty similar. For channel planning purposes you can easily recognize that channels 124 through 136 should not be used. Lots of channels are open and can be used in this range that will not cause any interference.
Spectrogram
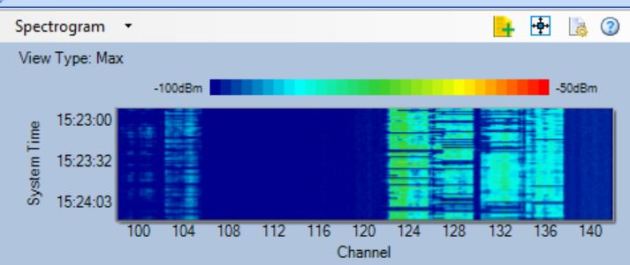
The next graph is the famous Spectrogram. The Spectrogram graph shows the amplitude of a signal over time. Basically it shows how busy and strong the signals are on that channel. These are also know as sweep or waterfall graphs. This graph shows how much signal density is on that channel. For example, if you have a channel maybe 104 that has traffic on it (seen by FFT), but its usage is very low (Spectrogram) then we know that that channel even though used would have very low interference, where as Channel 124 has lots of traffic and usage.
In the following graph the darker color shows more usage, notice Channel 124 which my STA is on.
 .
.
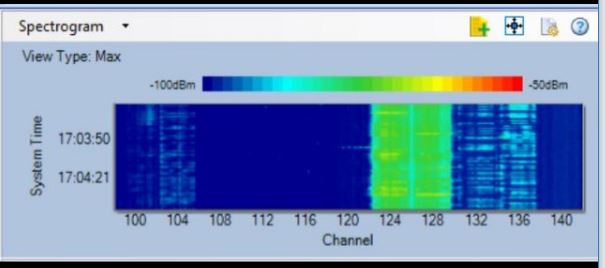
The following graph shows the spectrum after my station starts downloading a huge file on WIFI. Check out the difference in usage.
There are a lot of spectrum analysis graphs some are very helpful. These are two graphs that I find that help a lot to pinpoint the usage and channel use/layout of a wireless network. There are many more helpful graphs such as the wifi integrated graphs that can collect retries, Channel SNR, etc.
Cisco ISR 4000 Bridge group with Vlans
Posted by on March 6, 2018
The 4000 series does things a little differently with Bridge groups then older ISRs. The below is on a Cisco ISR 4331. In this case I needed to have a bridge group to go to two separate switches, one port would be blocked by spanning tree to keep loops out.
a Bridge-group, Groups the physical interfaces into one logical group. and the Bridge Virtual Interface (BVI) is the layer 3 routing interface associated to that bridge group.
In this scenario I have two vlans 4006 and 4007, I will create a bridge group so basically the two ports of the bridge group are a switch. Spanning tree will pass through the bridge group and one of my ports will be blocked. The reason for the bridge group if that I have two Distro switches and I want to have switch redundancy (Yes, I know the router is still a single point of failure). If one of my core switches die, it should be only a few seconds and I will be back up and going at Layer2 to my core. In this scenario I have a reason to not use ECMP or routing on the router interconnects – I need to keep them at layer 2.

Config:
bridge-domain 4006
bridge-domain 4007
interface GigabitEthernet0/0/0
description **Connected to Primary Core**
no ip address
negotiation auto
service instance 1 ethernet
encapsulation untagged
bridge-domain 1
!
service instance 4006 ethernet
encapsulation dot1q 4006
rewrite ingress tag pop 1 symmetric
bridge-domain 4006
!
service instance 4007 ethernet
encapsulation dot1q 4007
rewrite ingress tag pop 1 symmetric
bridge-domain 4007
!
int gig 0/0/2
description **Connected to Primary Core2**
no ip address
negotiation auto
service instance 1 ethernet
encapsulation untagged
bridge-domain 1
!
service instance 4006 ethernet
encapsulation dot1q 4006
rewrite ingress tag pop 1 symmetric
bridge-domain 4006
!
service instance 4007 ethernet
encapsulation dot1q 4007
rewrite ingress tag pop 1 symmetric
bridge-domain 4007
!
!
interface BDI1
no ip address
shutdown
!
interface BDI4006
ip address 1.1.1.1 255.255.255.0
!
interface BDI4007
ip address 2.2.2.1 255.255.255.0
no ip redirects
!
Thats, it. The Vlan and vlan interfaces are up and working. When I check spanning-tree on the switch I see the correct one blocked – which could totally be load balanced or modified.
