Tag Archives: tcpdump
Fortiauthenticator: Troubleshooting with tcpdump
Posted by on July 16, 2020
Had a strange issue the other day with a FAC, where it would not send emails to users with their assigned tokens, but would send emails just fine any other time. I wanted to capture all outgoing traffic to see if SMTP messages were really being sent.
Fortiauth has Tcpdump built in, and is very easy to run.
First SSH into the FAC, from there you have some execute options. Below shows the tcpdump options:
exe tcpdump?
tcpdump Examine local network traffic.
tcpdumpfile Same as tcpdump, but write output to a file downloadable via GUI.
exe tcpdump
If you run ‘exe tcpdump’ it will spit all the traffic to the screen, but if you run ‘exe tcpdumpfile’ it will log the output to a .pcap that is downloadable from the GUI. This gives you the option to open it in Wireshark and analyze.

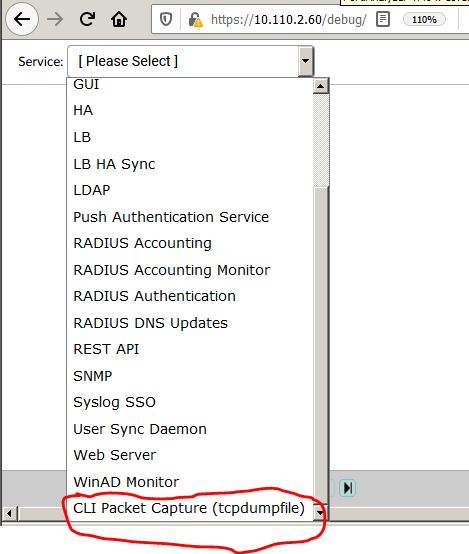
To download the .pcap open your Fortiauth append /debug to the web address for example: https://10.110.2.60/debug. From here you will be prompted with what you want to debug, and at the bottom is the option to open the “CLI Packet Capture” this gives you the option to download the pcap.

Thats it! Thank you Fortinet.
Vyatta Tshark examples
Posted by on March 19, 2014
Vyatta has so many tools built in to make troubleshooting much easier. Tshark is built into Vyatta, which is just modified Debian. TCPdump is also included.
Below are some examples of how to run tshark to troubleshoot connectivity in the vyatta at a lower level.
First drop into configuration mode with the command “configure”
sudo tshark -R “ip.addr == 192.168.0.150” -r /tmp/capture.cap
This will pull all communication to and from 192.168.0.150 on any interface
sudo tshark -R “ip.addr == 192.168.0.150” -r /caps/cap1.cap
This will pull all communication from specified IP and then write it to the file /caps/cap1.cap
lets say I want to find any communication on interface eth1
sudo tshark -i eth1
What if I want to find anything coming from ip address 1.1.1.1 on tcp port 80
sudo tshark -R “ip.addr == 1.1.1.1 and tcp.port == 80”
There are a ton of combinations to help with troubleshooting. Using Tshark is a great way to see if traffic is even making it to your firewall.