I recently added a switch later in the stack, and wanted to make sure the switches were numbered the same as the physical order in the rack. I found no way to do this in the GUI – probably is, but the CLI method works great.
Easy change, just go to CLI, modify the order – very similar to modifying firewall policy order.
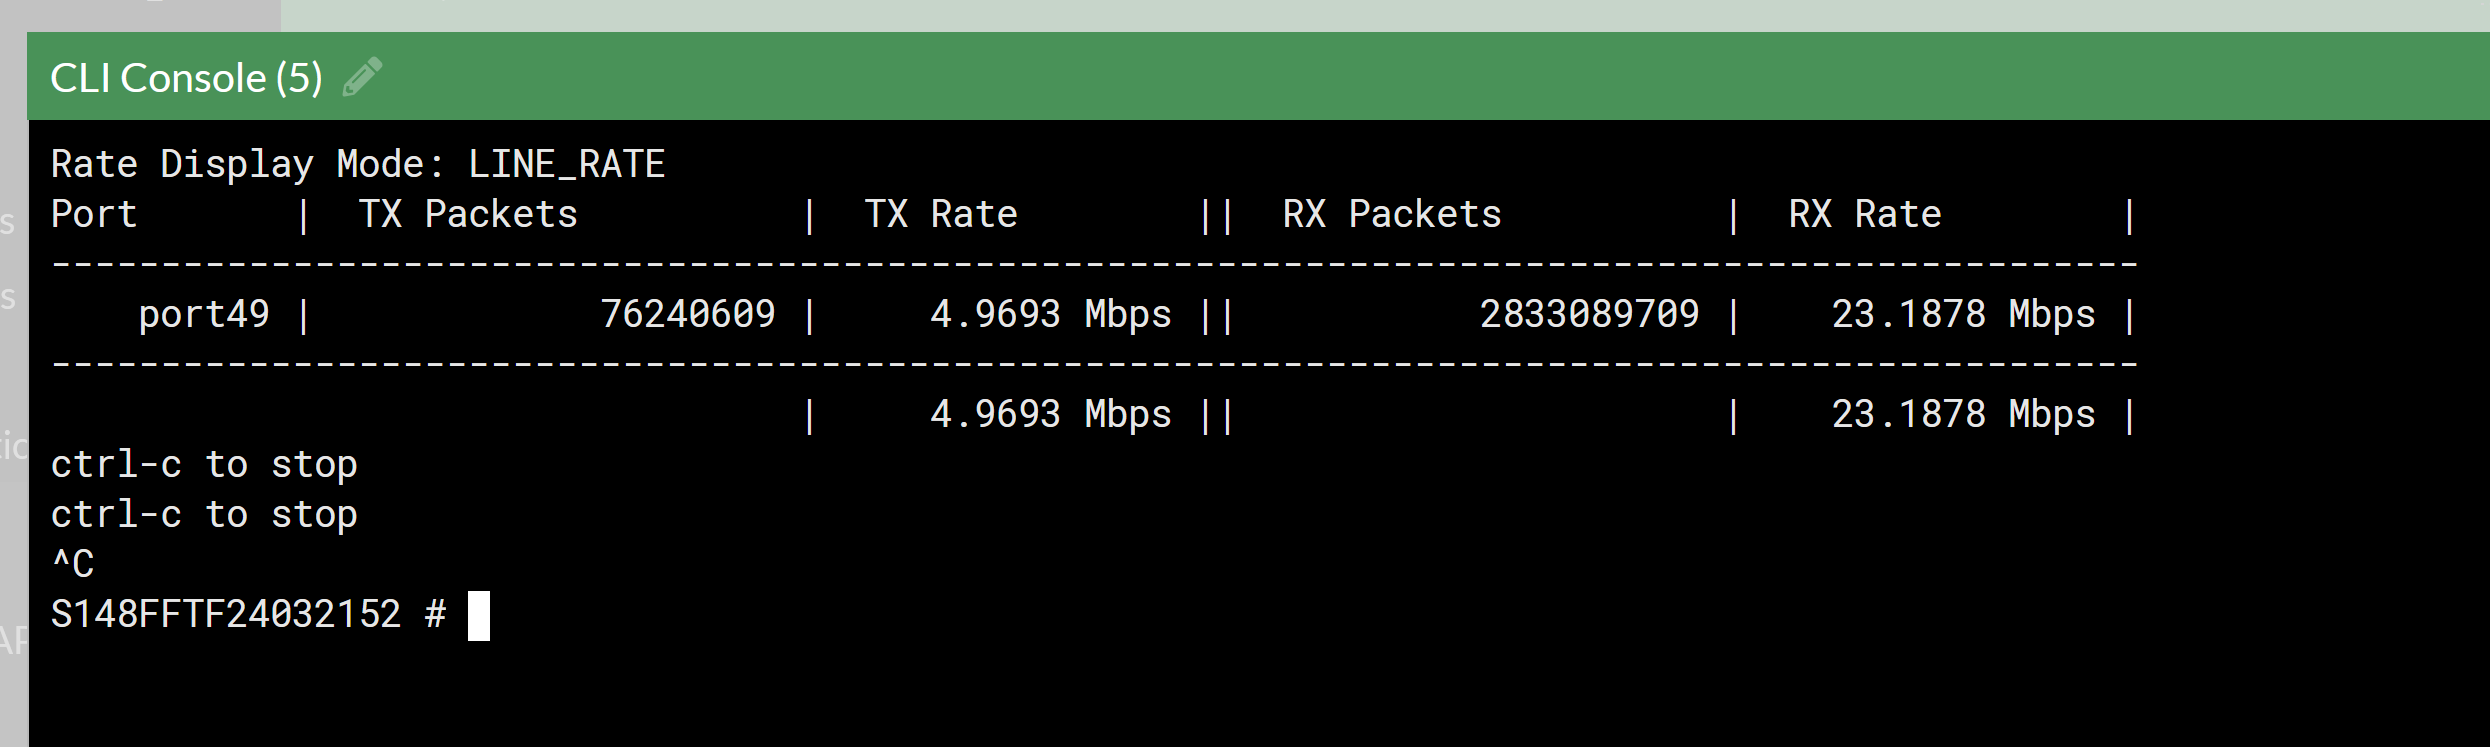
One very cool setting through CLI is to get the actual live bandwidth of the a port. You can do this to check uplink status, or just make sure you are not over saturating things.
You can do this by connecting into CLI of the Fortiswitch through the Fortigate. Here you can run this command:
dia switch physical-ports linerate
You can do the above command to get all port usage, and it updates every second, or put a specific port in. For example:
I needed to track down the power of one of our fiber ports – and had a hard time finding how through google-foo. Decided to document it. I did find this link if it helps anyone:
In the release notes of 7.2.12 and 7.6.4 you will see something like this:
After upgrading you will not be able to connect to the IDP until you fix this. This blog entry will show how to modify the signing options in Azure which will resolve the issue.
Once the firewall was upgraded, SAML auth was failing to Azure on the SSL VPN. I debugged out the authentication attempts (dia deb app samld -1) and saw the following: Signature element not found.
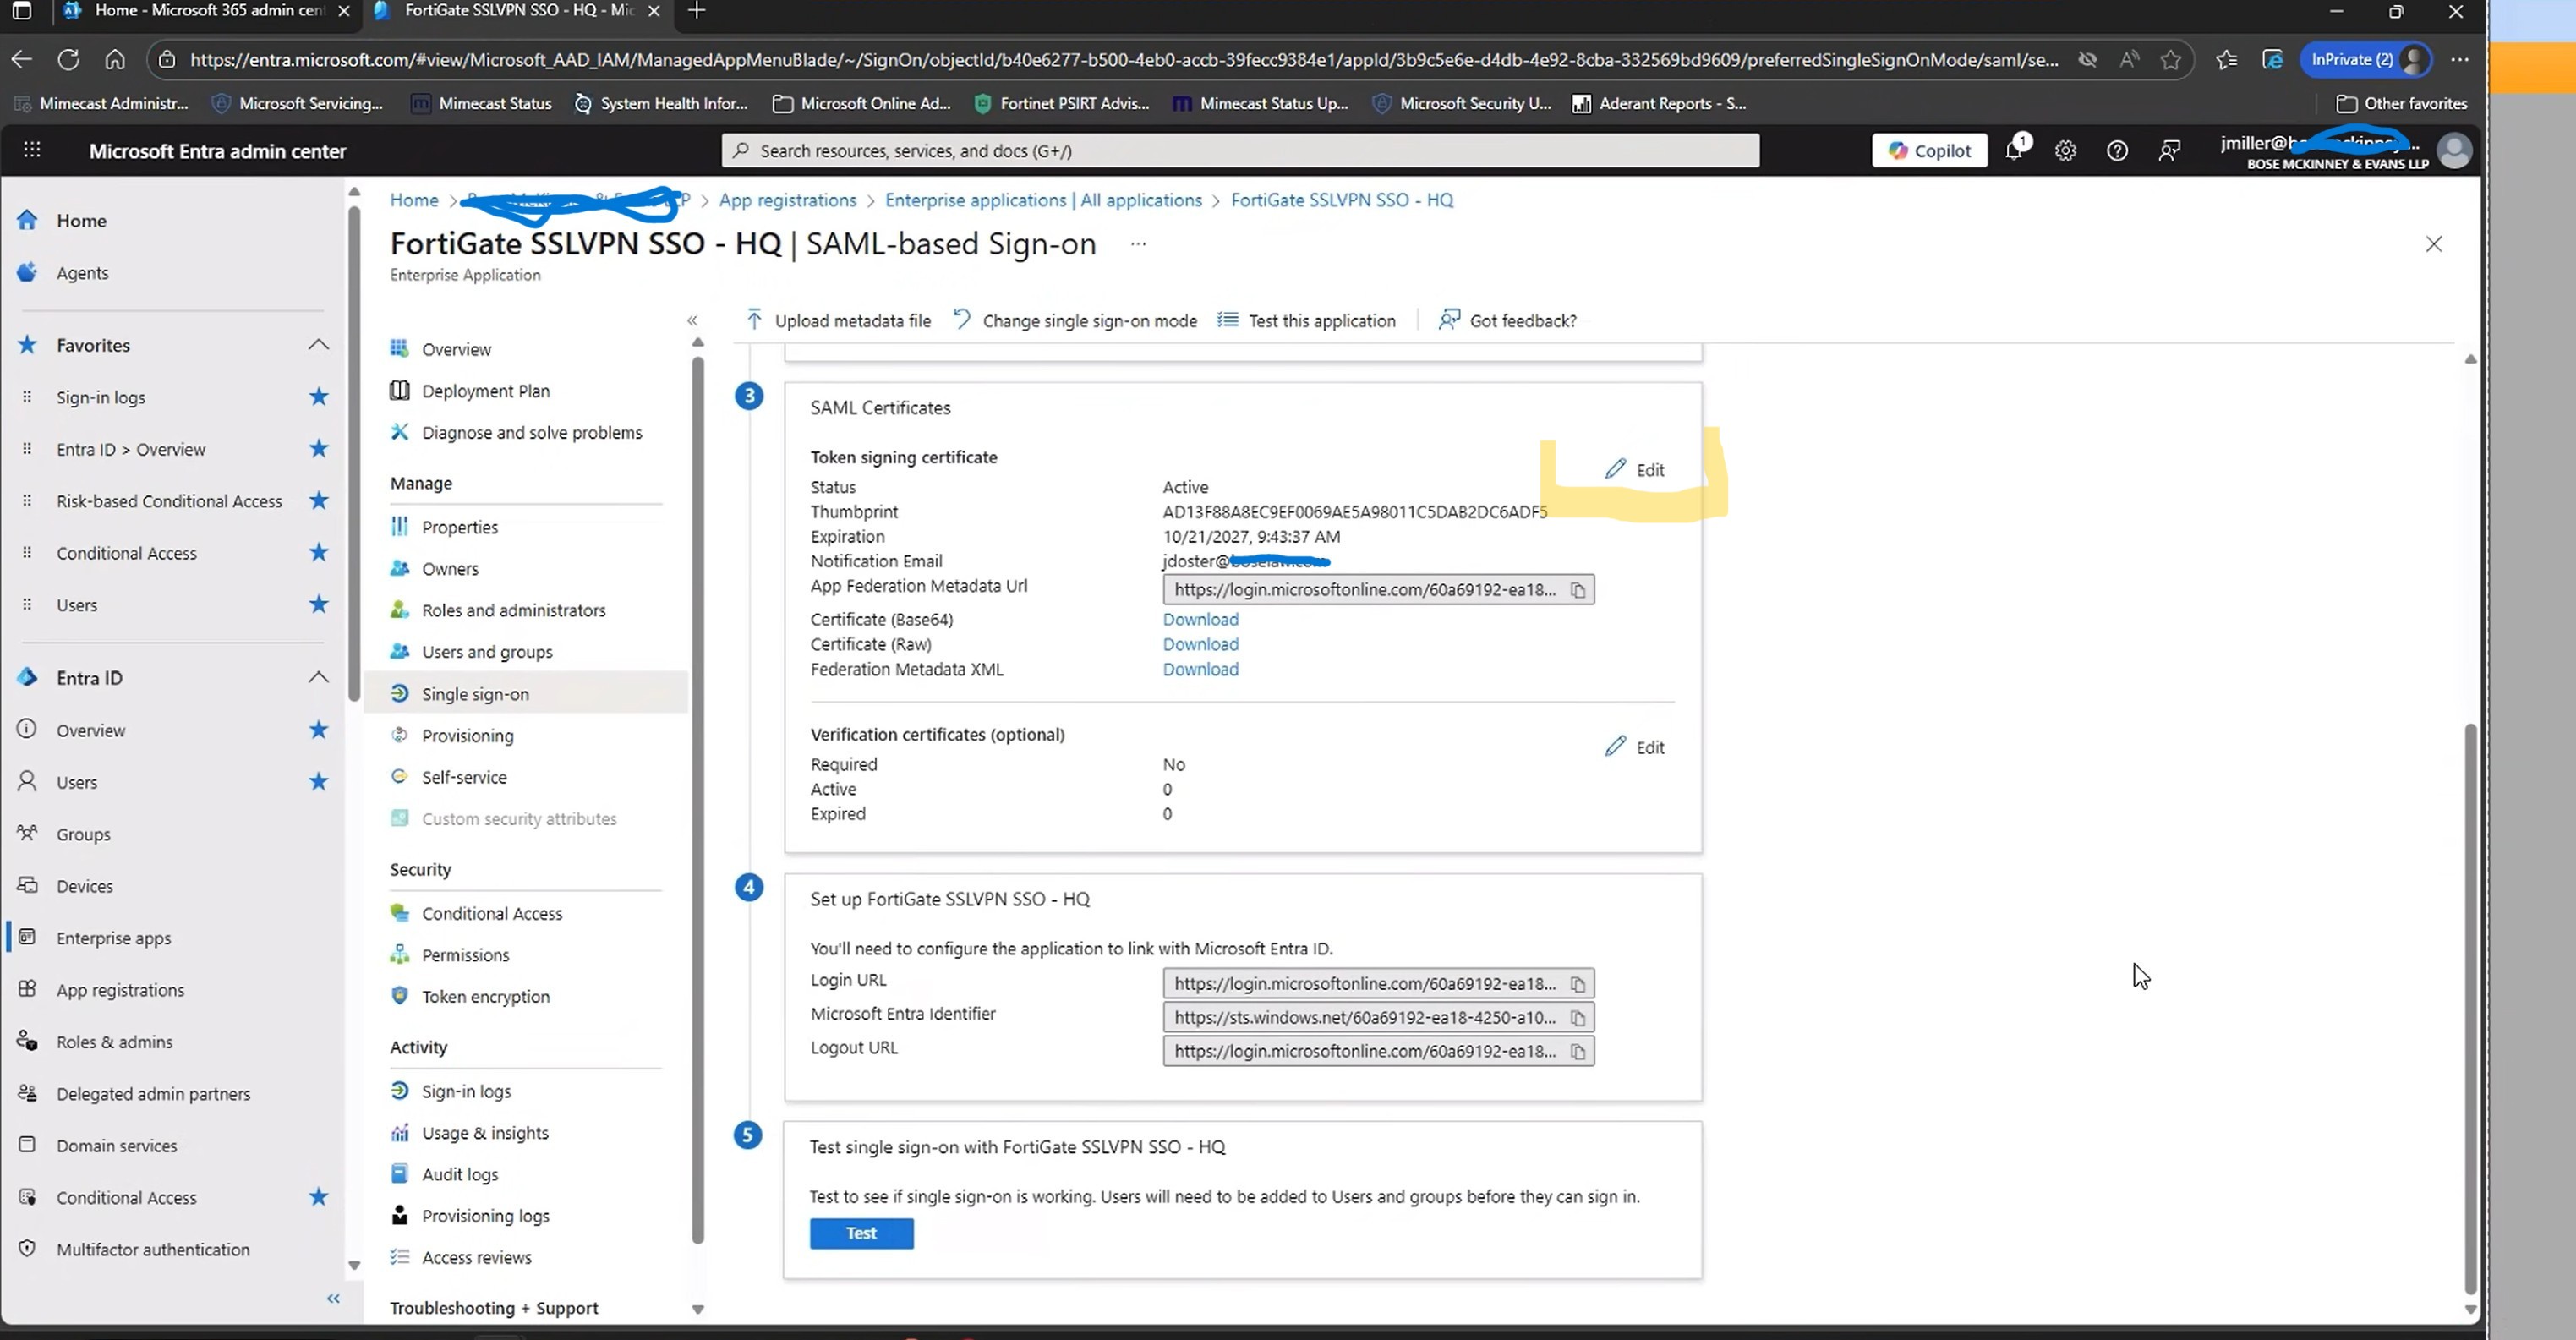
To fix this we have to go into Entra Apps, and the SSL VPN app we are using and modify the SAML signing option.
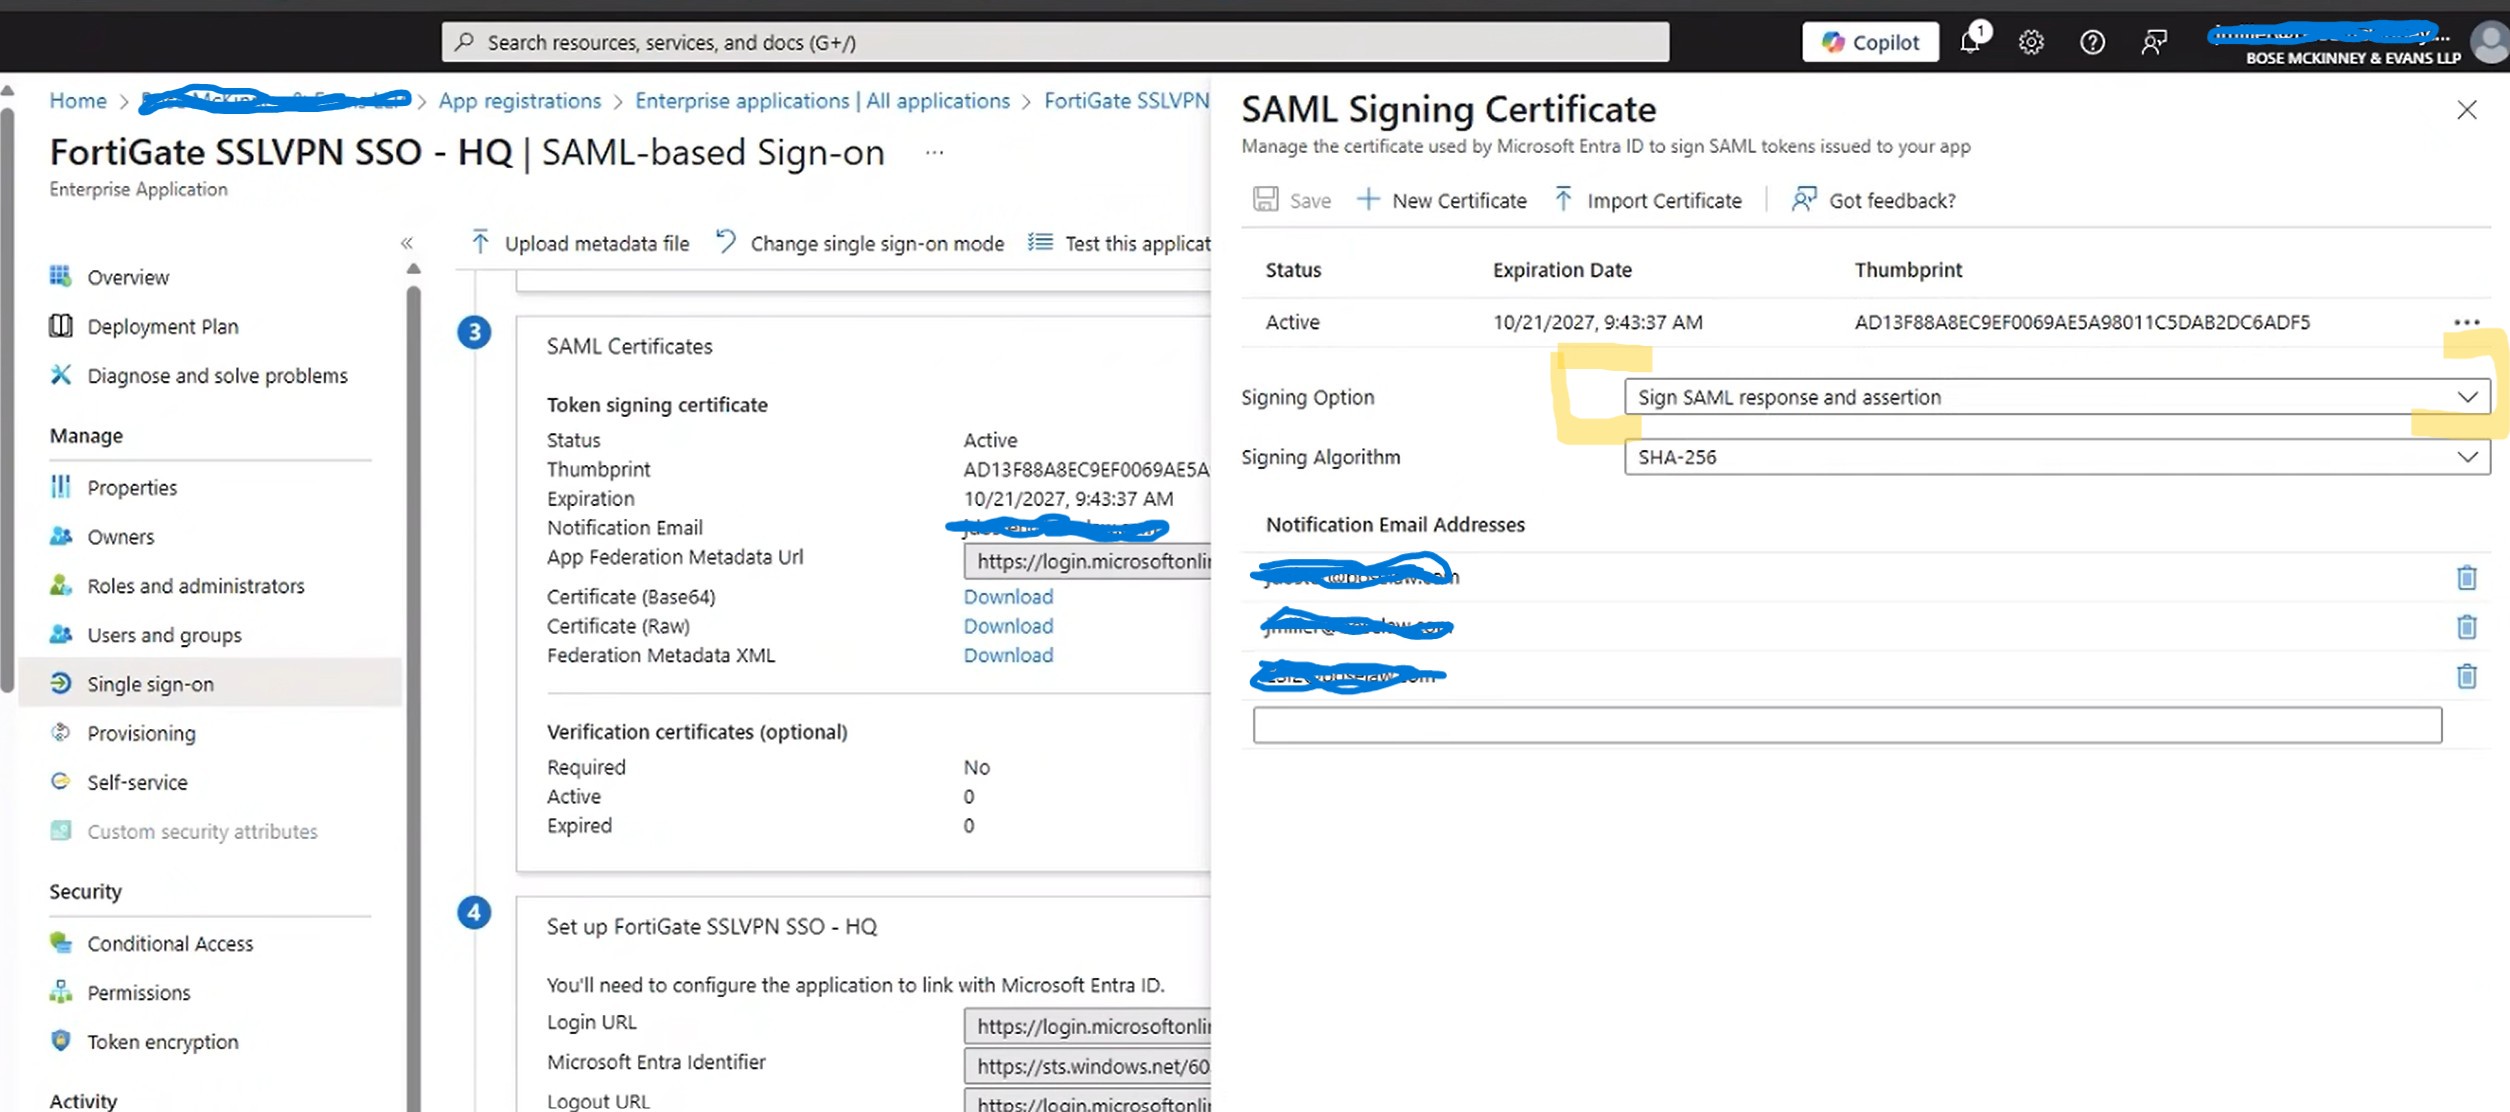
Check these two screenshots on how. First go to your app as mentioned above, and then the “Single Sign-on” section. Next click on the edit under the SAML cert selection.
Next lets change the setting for signing:
After changing these settings I was able to connect just fine. So whats actually happening here?
SAML signing involves using a digital certificate by an Identity Provider (IdP – Azure) to create a digital signature for a SAML Response or Assertion, which is then used by a Service Provider (SP or – Fortigate) to verify the data’s integrity and origin. A SAML Assertion contains user identity and authorization details, while the Response is the XML envelope that carries these assertions and other information from the IdP to the SP to facilitate Single Sign-On (SSO). Signing the entire Response ensures the whole message, including its assertions, is trustworthy and hasn’t been altered. So basically its a way to increase security by making sure that both parts are signed by the trusted IDP cert.
Now that I setup SD-WAN interfaces in Fortigate for almost any deployment – due to future proofing. I have struggled with how to make internal resources that need to nat out publicly from a certain IP (Not on the interface). In a normal scenario, no problem, we just use an IP pool for outbound traffic from that internal device(s). In the SD-WAN scenario, I had a problem where the outbound IP Pool for the outgoing nat would still try to hide the IP behind a IP that lived on the WAN that is having the outage. The firewall policy seemed not to be smart enough to say – “ahh that interface is down, lets make sure it goes out of policy 2”. One option I did was have two policies – one to nat out of each ISP, then to have a automation stitch to see the interface go down, and disable the normal policy, which would then hit the lower policy.
The option I am describing below is much better.
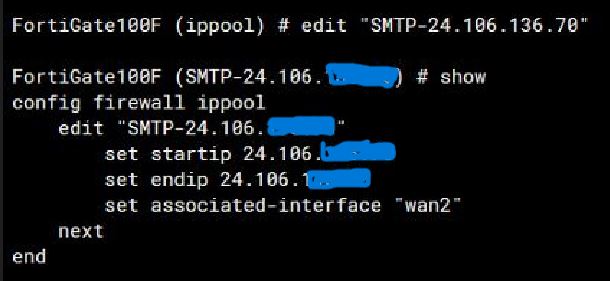
Within the IP pool there is an option within CLI to set an associated interface. This fixes the issues. So, I have two IP Pools, one for ISP 1, and the other for ISP 2. So to talk through the setups – there are a couple.
Create SDWAN
Create SDWAN rules send traffic out of needed interfaces.
Next create the IP pools, and in CLI set the associated interface.
Create a firewall policy matching the correct object, and add both IP pools in the IP pool list. The SDWAN rule will set with VIP is used based on SLA Method.
Below details how to enable Syslogging for both the controller and APs.
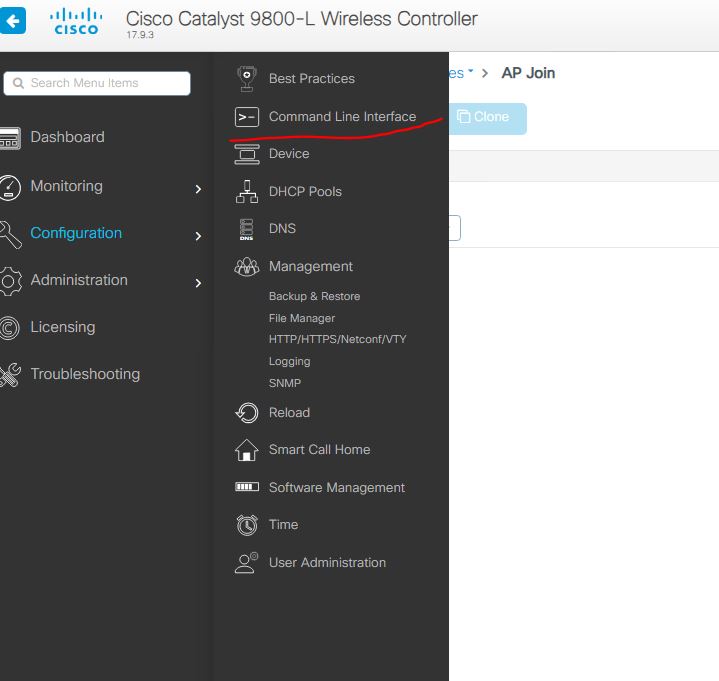
In the controller, it seems its CLI only (If not, please comment how to do from GUI). First lets set the Controller to send syslogs. Navigate to Administration and CLI:
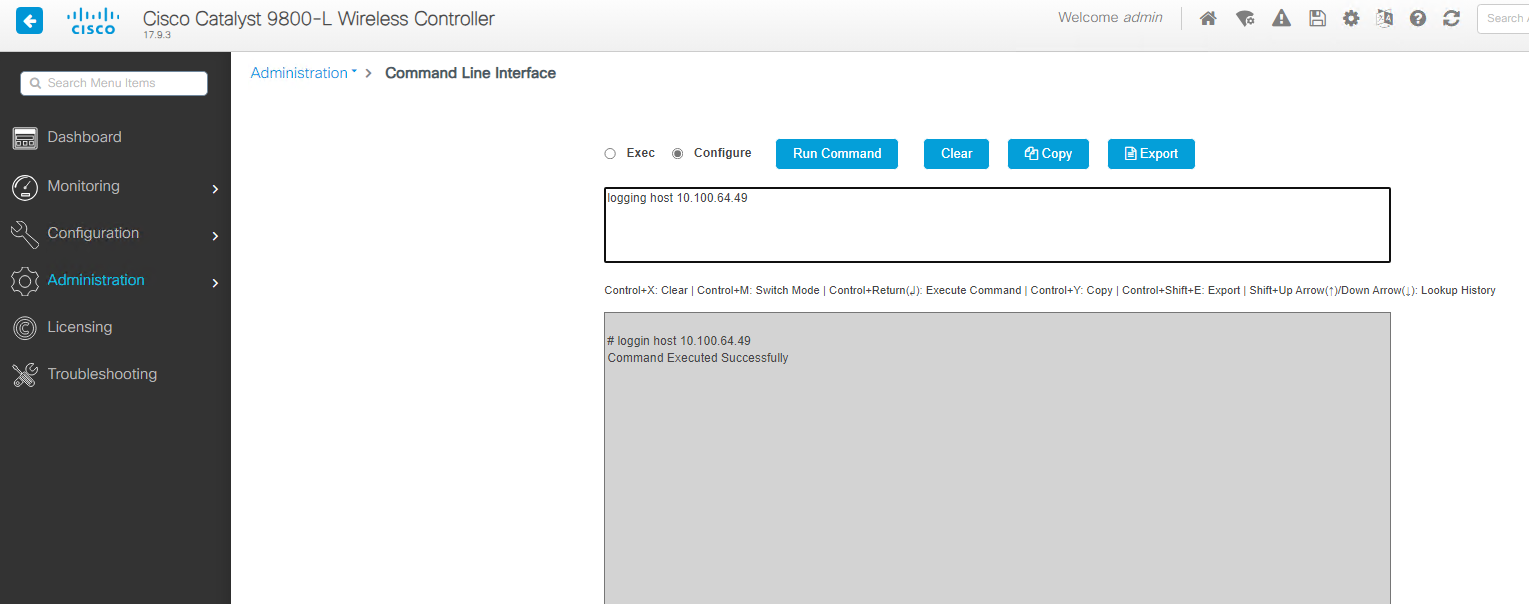
– then change the options to run as configuration. Next enter in the info you need. Below is the commad:
logging host <IP Address> transport <TCP/UDP> port <PortNumber>
All is default with my needs, so here is the command I will use : logging host 10.100.64.49
Thats it for the controller- now the APs.
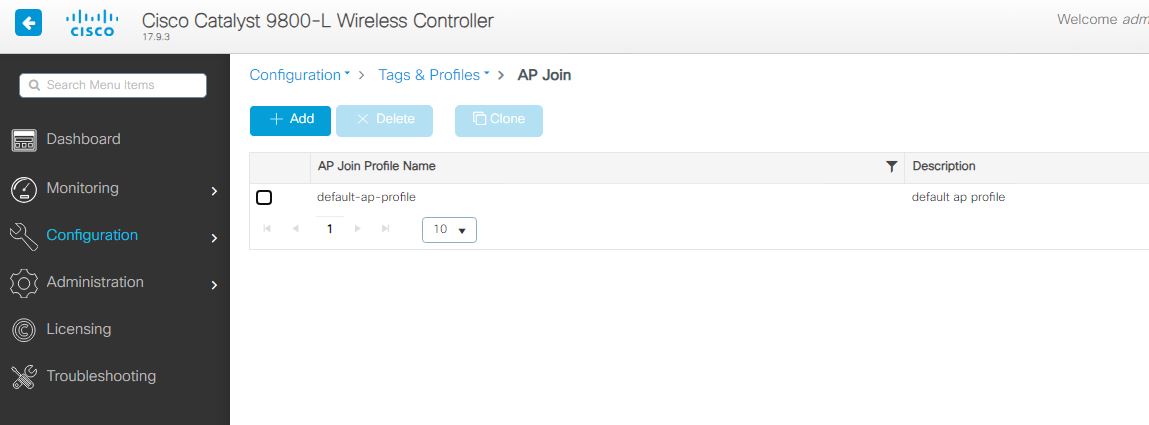
To set the APs you can use the gui – the settings are located in the AP profile, in my example, its still default. Very small deployment. Configuration – Tags and Profiles – then the AP Join profile.
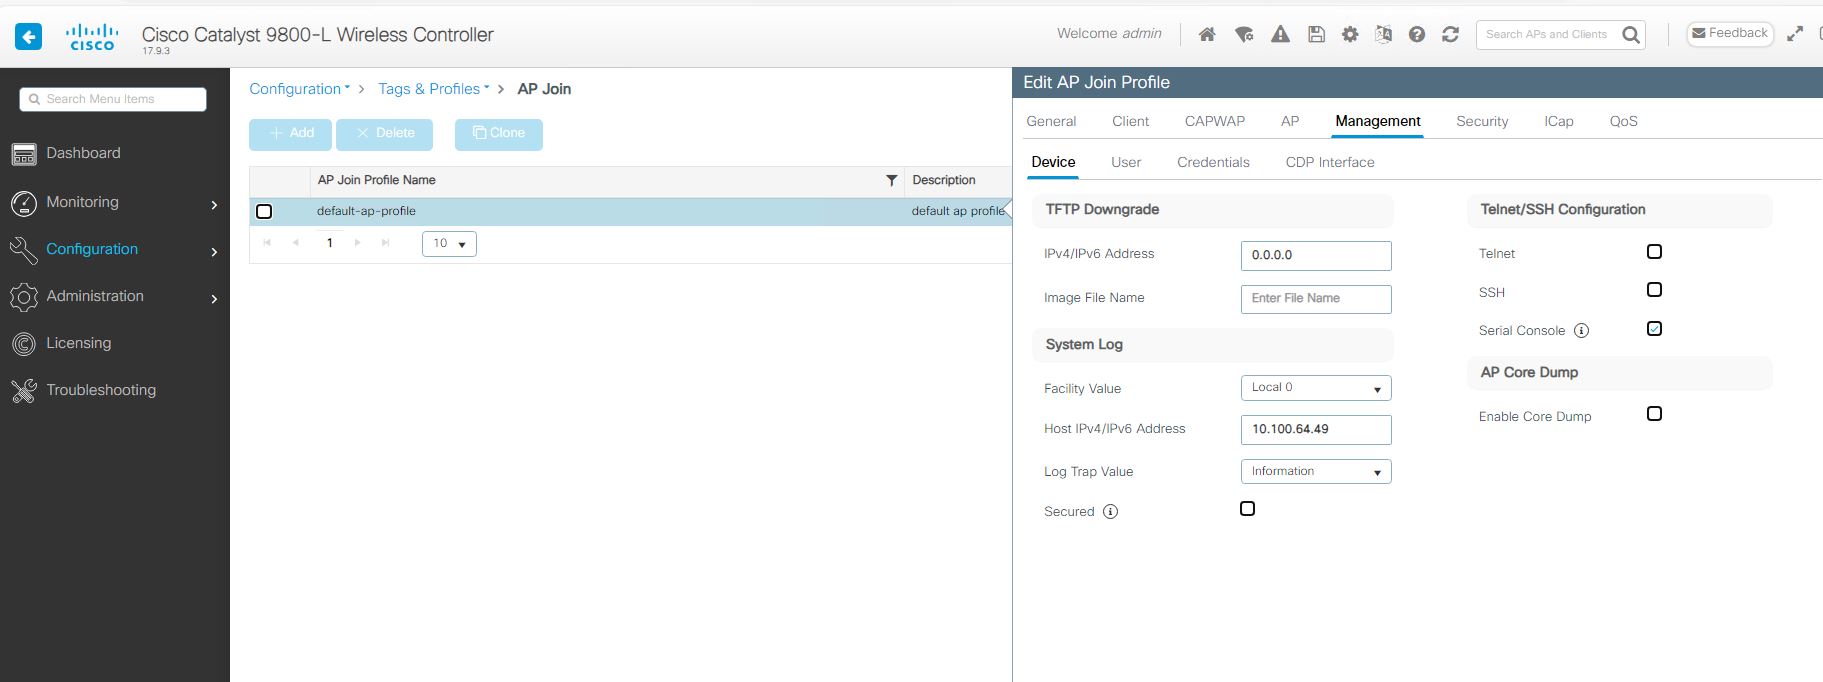
Once you open the needed profile to modify you will have the below settings – You see the Management tab. Once you open that tab, you will see the System log settings. Just set to what you need, apply, and don’t forget to save!
I found this a neat tidbit of knowledge that I thought I should share.
Created a Fortinet SDWAN setup with many sites – works awesome. Fortinet’s SDWAN is simple, but very effective with some really cool features to help with SLAs.
During this setup, I have Radius, and LDAP servers located across one of the members of the SDWAN (An IPSEC tunnel). As before with tunnels, you would modify the source address in CLI for the destination server. This would make sure requests originate from the interface you are expecting, and will go through the tunnel.
After switching the tunnel to be a member of a SDWAN interface the LDAP/RADIUS requests stopped working. I found another command was needed. This command is needed not only for Radius, and LDAP but also for FAZ, Fortiguard, and dns.
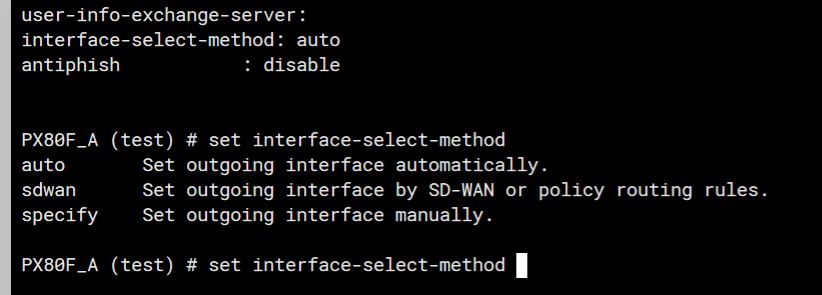
In CLI of both Radius and LDAP servers you will see these options:
The trick here is to set the “interface-select-method” to sdwan. This resolved my issue and allowed things to start working. The reason it does this is that Self-originating traffic, such as Syslog, FortiAnalyzer logging, FortiGuard services, remote authentication, and others, relies on routing table lookups to determine the egress interface that is used to initiate the connection. Policy routes generated by SD-WAN rules do not apply to this traffic.
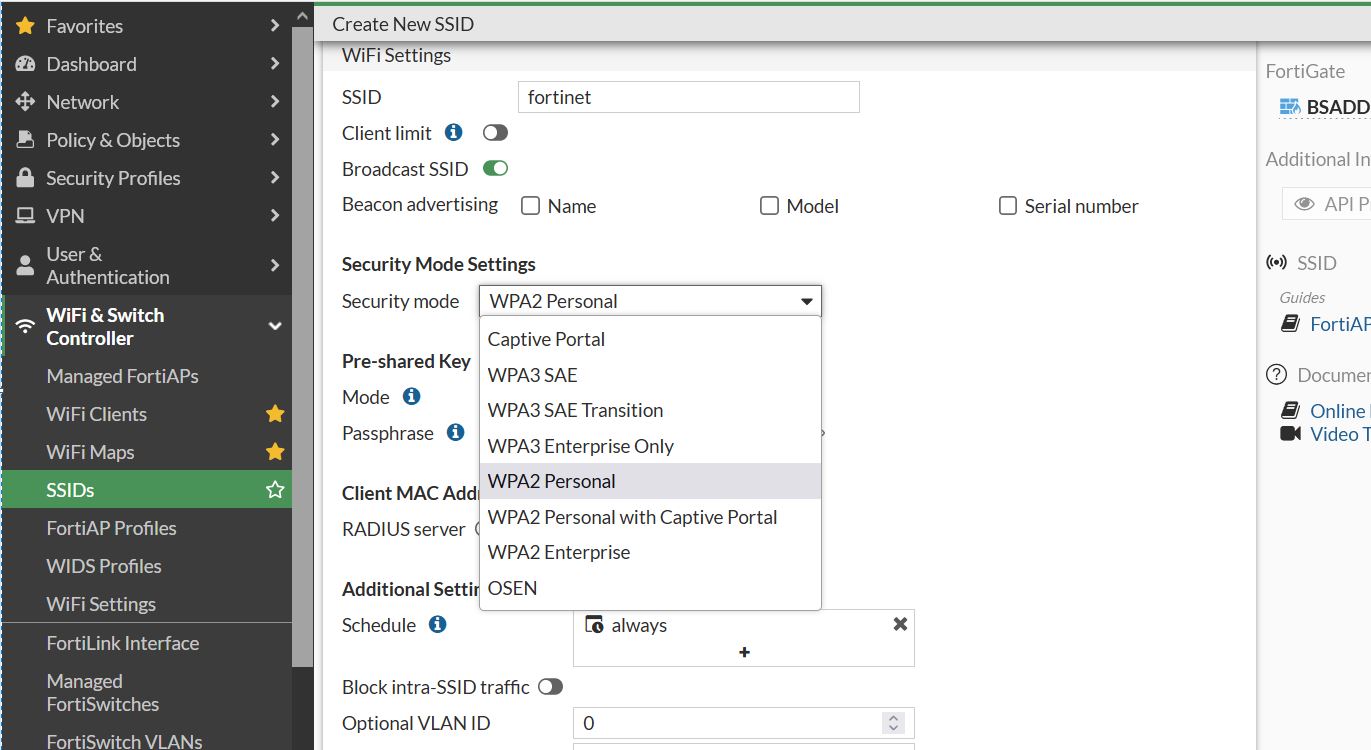
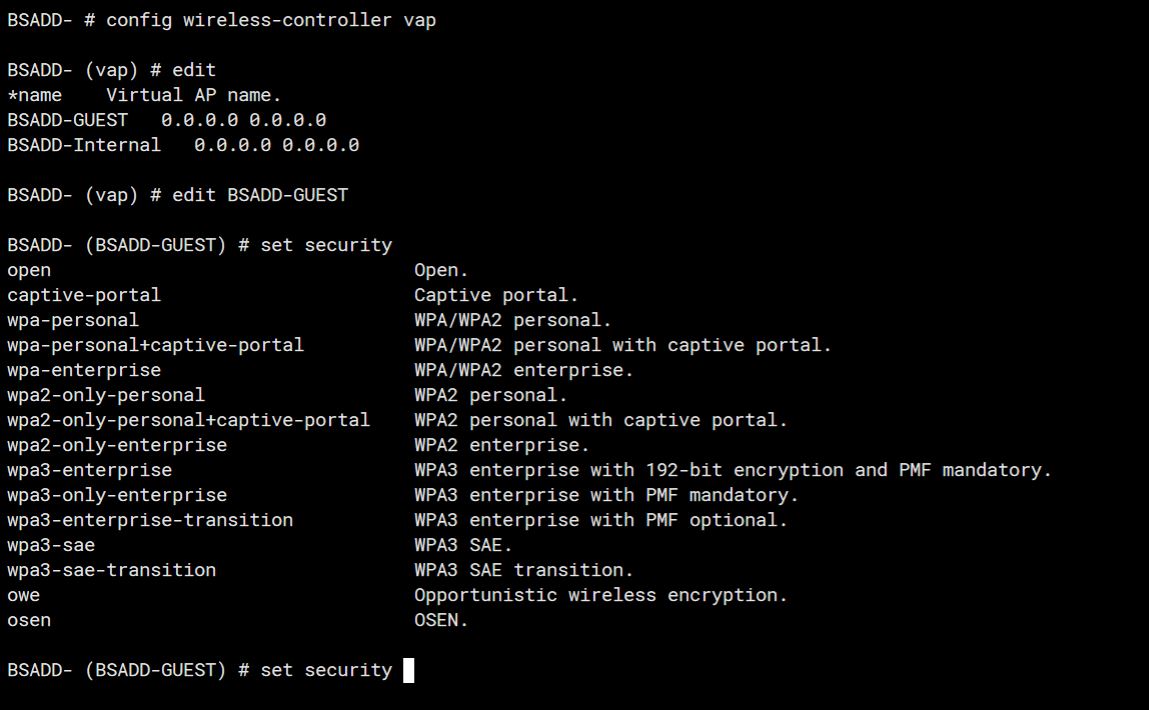
I was creating an SSID from within the Fortigate to manged Fortiaps and noticed I could not change the security to “Open”. The only options were security options, and Captive-Portal. I was like, where is Open?
One of the best troubleshooting steps for Radius/NPS is to look in the event viewer to see why you are having failures. This shows if the server is actively denying the user login attempts due to Creds/Certificate/etc.
Sometimes your successes for failures do not show up in Event viewer – this is usually to do with audit logging not including everything. There are a few ways to modify this – but here I will show two easy ones.
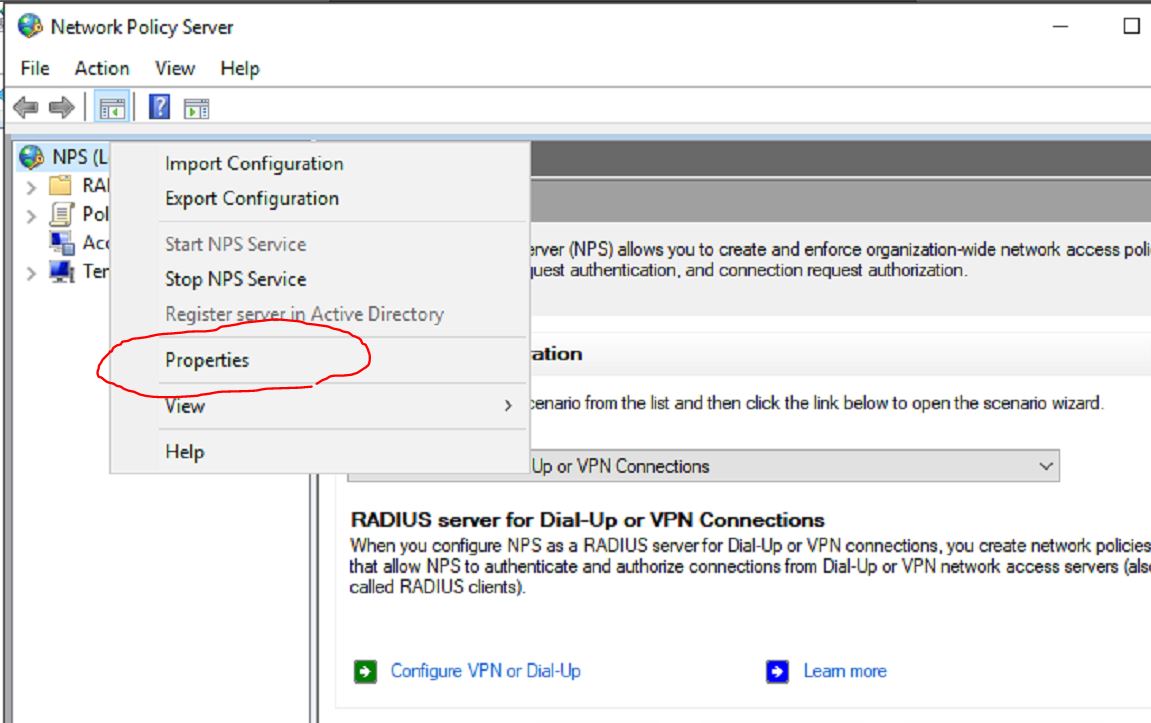
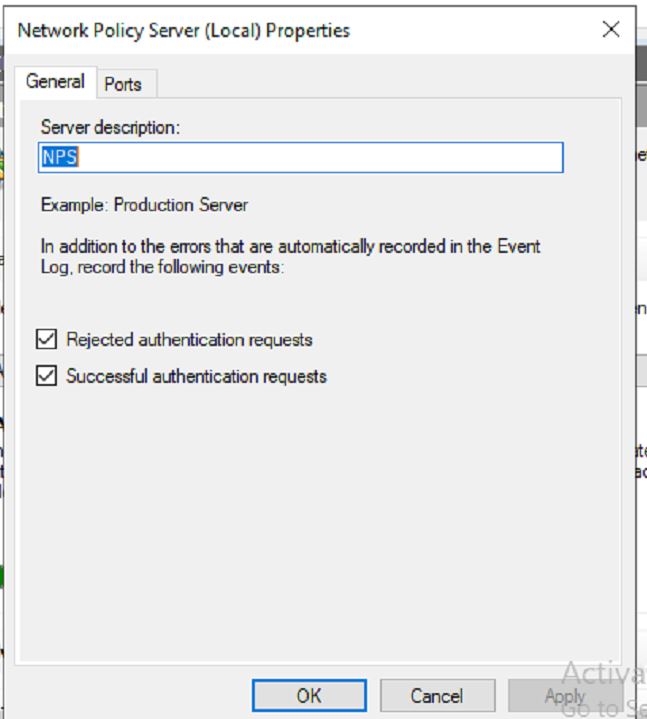
The first is to use the NPS settings to make sure these logs are recorded – Even those these might be checked, I have seen the logs not recorded. I do believe the Audit policy overrides these settings. Our first step is to open up NPS, and right click on the NPS server.
Then we can open up properties and make sure all settings are checked.
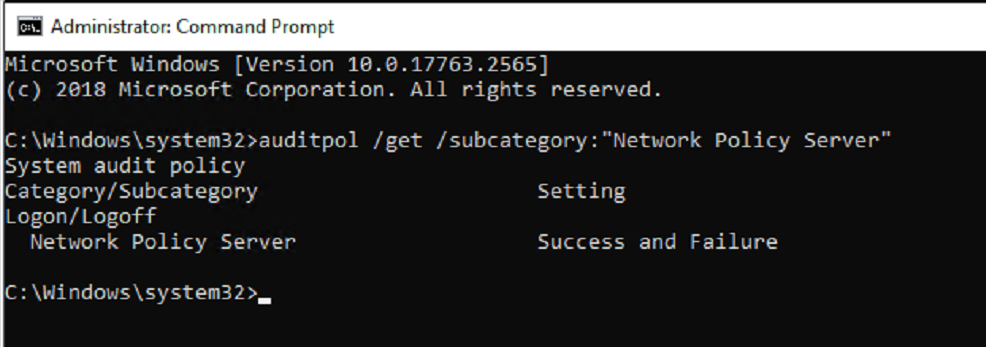
Our next option is to use the Audit policy CLI commands to set the success or failure to enable (Enable – enables logging).