Tag Archives: Vyatta

Configuring an IP address and enabling services such as SSH/HTTPS on Brocade Vyatta CLI

When Brocade purchased Vyatta I was nervous, but they have done a really good job with it. They keep it updated, and now have added a lot of functionality and increased services with the 6400 version. Both the 5600 (pretty much old vyatta) and the newer 6400 Vyatta IOS are for free from Brocade fro 60 days.

This blog entry is just showing some very simple things such as adding a IP address to an interface and enabling the HTTPS and SSH service. In another entry i will show how to use other user authentication methods for user logins. Although all of these commands are very easy, this post could help someone who might be in a bind.

Configure an IP address.

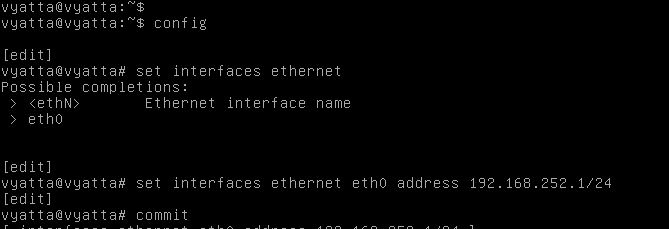
The Vrouter CLI has always been intuitive for me. Each config option is really an objects configuration. You can delete the config altogether or just an individual config setting of the object. To set the IP address first you have to go into configure mode.

configure

set int ethernet eth0 address 192.168.252.1/24

commitremember nothing is set, until this is entered.

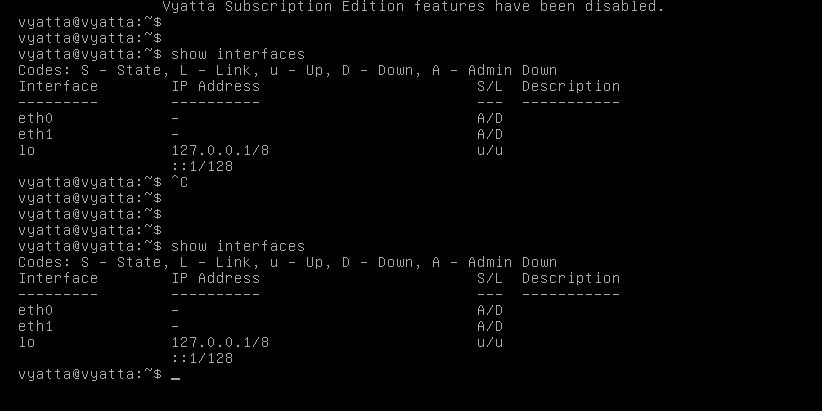
The image below shows these commands in the actual CLI.

ip-1

We can also save the config in config mode by issuing the command “save”.

That’s, it we have now set an IP address.So on to enabling SSH and HTTPS access.

HTTPS

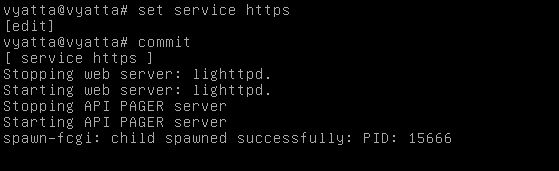
To enable HTTPS we need to issue the command (from config mode)

set service https

commit

As you can see from the image below, after those commands are entered the Vyatta generates a certificate, and restarts its web server.

https2

SSH

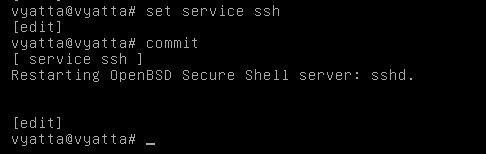
Enabling SSH is as easy as the other commands.

From config mode

set service ssh enable

commit

You also have options to allow root login, set the listen address, and change the port.

SSH

Hot add Nic into Vyatta VM – no reboot required

Recently I was asked about how to add a nic to a Vyatta VM, my reply “add it in VMware and reboot”- their response “We cannot reboot”. I asked why they can’t reboot and they said “If we were to reboot this Vyatta (Bring down the Client VPNs) then we would have to send out an email a ton of clients and let them know” – huge ordeal .

So we need to add a nic via VMware, and then have Vyatta recognize that nic right away, with out a reboot. So I added the Nic (see image below) in VMware:

Add-int

After I add the NIC, I can look on the Vyatta and see it still shows only two NICs.

showint

So, VMware added the nic but Vyatta(debian) never sees it. After trying to ifup/ifdown , service network restart – and many other commands it could never find it.

So, what is needed – we have to rescan the PCI bus to find the nic. Most Linux users are probably like — ya of course you do! But I just reboot and it works. In this case cant reboot.

To Rescan the PCI bus, we have to first change our permissions on that file, echo into that file, than change the permissions back. The commands to do so are:

configure

sudo chmod 0777 /sys/bus/pci/rescan

sudo echo 1 > /sys/bus/pci/rescan

sudo chmod 0220 /sys/bus/pci/rescan

After doing that look at your interfaces:

int3

Now we see the interface and can configure it. This process should work with Debian no problem (since Vyatta is Debian).

Vyatta out of space?

Today I had a vyatta that has limited HD space and could not  bring up VPN tunnels due to the lack of space. The below command is what I used to find the largest folder on the Vyatta file system :

find / -type f -size +20M -exec ls -lh {} \; 2> /dev/null | awk '{ print $NF ": " $5 }' | sort -nk 2,2

The command above searches the whole file system and reports back files larger than 20M.

I found that my wireshark folder had a lot of old captures. I navigated to the folder and removed all old captures and that freed up the missing space.

Using Logrotate in Vyatta to manage logs

Logrotate is a tool that is built into Debian which is really what Vyatta is built on. Logrotate is a tool that allows automatic rotation, compression, removal, and mailing of log files.  Each log file may be handled daily, weekly, monthly, or when it grows too large. Recently I had an issue where all the space on my Vyatta was filled up, after some investigation it was the auth.log that had reached a couple hundred mb. After clearing it I was fine. After more investigation I found that auth.log was never in the logrotate config.

Below is an example. In this example if the size of the log file gets above 50m it will copy itself (by rotating), compress the copy and then start logging to the new auth.log. In another 50m it will rotate back. So at most I would have 100m of auth.log.

/var/log/auth.log {
size 50M
rotate 2
create
compress
}

I would just edit the /etc/logrotate.conf file and add this in.


Vyatta Default gateway Script creation

I had to add a script into Vyatta the other day due to a bug in the OS. Well, bug might be a bad word, I think it was a driver issue with the NICs we were using. Any, the Vyatta would show the NIC as operation and up, but would not add the IP subnet configured on it into the routing table. Because of this, the default gateway would never come up. Since Vyatta is really just Debian the script creation is very simple.

This was Brocade’s VRouter 6.6 R3.

What I did was create a script in /etc/rc.d/ , change privileges, and then add it to rc.local.

Sample script

#!/bin/bash
sudo route add default gw 1.1.1.1 eth3

I save this into /etc/inid.d

then run : sudo chmod 755 /etc/init.d/Default-GW-Script

Next edit /etc/rc.local and add the script to run.

After a restart this came up no problem.


Monitoring the Vyatta firewall

You can monitor the firewall in much the way of a Debug command in Cisco. By using the command “Monitor firewall”. The blocked or allowed attempts will show up on the console.

You can monitor just the rule, or the whole firewall policy. By specifying the monitor to run in the background you still have control of the Vyatta.

The command is:

monitor firewall name OUTSIDE-IN background

You can also use the log keyword in the firewall rule to get the results of the rule to show up in the logs.

To give a better example lets create a firewall policy, assign it to an interface and then monitor the rule. I have two rules, one to block ICMP and one to allow everything else. To make this policy stateful I modified the firewall State-policy and set it to allow return traffic by default. Below are my firewall settings:

fw1

Now lets say I want to monitor what gets blocked in rule 5 – my block ICMP rule. I would do the following:

monitor firewall name out rule 5 – the name of my policy is “out”, rule 5 blocks ICMP.

block-rule

The image shows the output. All traffic matching that rule gets displayed on the screen. This is a great way to debug firewall polices to see what gets blocked or allowed. For example, if I monitored just the firewall policy i would get all traffic allowed or blocked, if I monitored rule 10 then I would get all traffic other than ICMP which would be allowed.

Below are the “show configuration commands” of the firewall policy if you are interested.

set firewall name out rule 5 action ‘drop’
set firewall name out rule 5 log ‘enable’
set firewall name out rule 5 protocol ‘icmp’
set firewall name out rule 10 action ‘accept’
set firewall name out rule 10 log ‘enable’
set firewall name out rule 10 protocol ‘all’
set firewall name out rule 10 source address ‘192.168.60.10’
set firewall state-policy established action ‘accept’
set firewall state-policy invalid action ‘drop’
set interfaces ethernet eth1 firewall out name ‘out’

Vyatta Tshark examples

Vyatta has so many tools built in to make troubleshooting much easier. Tshark is built into Vyatta, which is just modified Debian.  TCPdump is also included.

Below are some examples of how to run tshark to troubleshoot connectivity in the vyatta at a lower level.

First drop into configuration mode with the command “configure”

sudo tshark -R “ip.addr == 192.168.0.150” -r /tmp/capture.cap

This will pull all communication to and from 192.168.0.150 on any interface

sudo tshark -R “ip.addr == 192.168.0.150” -r /caps/cap1.cap

This will pull all communication from specified IP and then write it to the file /caps/cap1.cap

lets say I want to find any communication on interface eth1

sudo tshark -i eth1

What if I want to find anything coming from ip address 1.1.1.1 on tcp port 80

sudo tshark -R “ip.addr == 1.1.1.1 and tcp.port == 80”

There are a ton of combinations to help with troubleshooting. Using Tshark is a great way to see if traffic is even making it to your firewall.