Cisco ASA (Pre X series) are still extremely common.
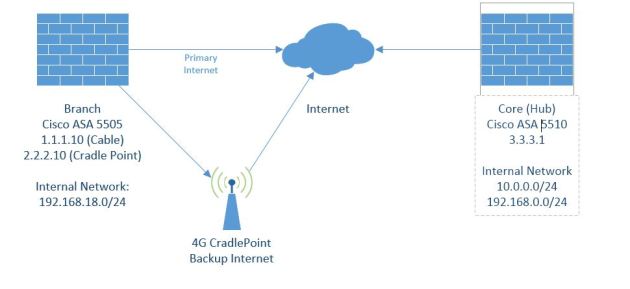
This entry describes a redundant VPN setup of two ISPs on the Branch firewall (Cisco 5505), and one ISP on the Datacenter/hub side (Cisco ASA 5510).
The Branch office has a cable connection as their primary ISP and a backup 4G Cradle Point. We will be using SLAs to track the internet status of the Cable connection, and a floating static route to control backup route priority.
The idea behind the branch office is that two different Crypto Maps exist, one mapped to each of the interfaces. If the SLA fails and brings down the primary internet the traffic starts going out of the backup connection which has a backup Crypto map applied. When the primary interface comes back up, then traffic will start going over the crypto map applied to it. Therefore we do not have flip/flop VPNs and it solves the issue of having one crypto map applied to two different interface.
CONFIG
Branch ASA:
interface Vlan2
nameif PRIMARY
security-level 0
ip address 1.1.1.10 255.255.255.0
!
interface Vlan12
nameif BACKUP
security-level 0
ip address 2.2.2.10 255.255.255.0
object-group network CORE-SUBNETS — Object group for Core subnets
network-object 10.0.0.0 255.255.255.0
network-object 192.168.0.0 255.255.255.0
object-group network BRANCH-SUBNETS — Object group for Branch subnets
network-object 192.168.18.0 255.255.255.0
object network Any-Cable — NAT For Primary
nat (inside,PRIMARY) dynamic interface
object network Any-Backup — NAT For Backup Internet
nat (inside,BACKUP) dynamic interface
NO-NAT
nat (inside,any) source static BRANCH-SUBNETS BRANCH-SUBNETS destination static CORE-SUBNETS CORE-SUBNETS
SLA config:
sla monitor 123
type echo protocol ipIcmpEcho 8.8.8.8 interface PRIMARY
sla monitor schedule 123 life forever start-time now
route PRIMARY 0.0.0.0 0.0.0.0 1.1.1.1 1 track 2 – The Track statement maps that SLA to the route
route BACKUP 0.0.0.0 0.0.0.0 250 – Floating Static – Makes this a backup route. I set the distance to 250
VPN CONFIG:
access-list VPN-to-CORE permit ip object-group BRANCH-SUBNETS object-group CORE-SUBNETS
crypto ipsec ikev1 transform-set AES256SHA esp-aes-256 esp-sha-hmac
Primary Crypto
crypto map BRANCH_MAP 100 match address VPN-to-CORE
crypto map BRANCH_MAP 100 set peer 3.3.3.1
crypto map BRANCH_MAP 100 set ikev1 transform-set AES256SHA
crypto map BRANCH_MAP 100 set security-association lifetime seconds 28800
crypto ikev1 enable PRIMARY
crypto map BRANCH-MAP interface PRIMARY
BACKUP Crypto MAP
crypto map BRANCH-MAP-BK 100 match address VPN-to-CORE
crypto map BRANCH-MAP-BK 100 set peer 3.3.3.1
crypto map BRANCH-MAP-BK 100 set ikev1 transform-set AES256SHA
crypto map BRANCH-MAP-BK 100 set security-association lifetime seconds 28800
crypto map BRANCH-MAP-BK interface BACKUP
crypto ikev1 enable BACKUP
crypto ikev1 policy 10
authentication pre-share
encryption aes-192
hash sha
group 2
lifetime 86400
Tunnel Group
tunnel-group 3.3.3.1 type ipsec-l2l
tunnel-group 3.3.3.1 ipsec-attributes
ikev1 pre-shared-key password
Core Config:
object-group network CORE-SUBNETS — Object group for Core subnets
network-object 10.0.0.0 255.255.255.0
network-object 192.168.0.0 255.255.255.0
object-group network BRANCH-SUBNETS — Object group for Branch subnets
network-object 192.168.18.0 255.255.255.0
NO-NAT
nat (inside,any) source static BRANCH-SUBNETS BRANCH-SUBNETS destination static CORE-SUBNETS CORE-SUBNETS
VPN CONFIG:
access-list VPN-to-BRANCH permit ip object-group CORE-SUBNETS object-group BRANCH-SUBNETS
crypto ipsec ikev1 transform-set ESP-AES-256-SHA-TRANS esp-aes-256 esp-sha-hmac
crypto map outside_map 100 match address VPN-to-BRANCH
crypto map outside_map 100 set peer 1.1.1.10 2.2.2.10 —Notice both IPs
crypto map outside_map 100 set ikev1 transform-set ESP-AES-256-SHA
crypto map outside_map 100 set reverse-route
crypto ikev1 enable outside
crypto map outside_map interface outside
crypto ikev1 policy 10
authentication pre-share
encryption aes-192
hash sha
group 2
lifetime 86400
tunnel-group 1.1.1.10 type ipsec-l2l
tunnel-group 1.1.1.10 ipsec-attributes
ikev1 pre-shared-key password
tunnel-group 2.2.2.10 type ipsec-l2l
tunnel-group 2.2.2.10 ipsec-attributes
ikev1 pre-shared-key password
 .
.